
1. Introduction
In the relentless pace of modern financial markets, consistent profitability demands discipline rather than instinct. Quantitative Trading Basics: Automate provides that framework, transforming raw market data into clear, executable rules. Early in my career, I relied on gut feelings and headlines, only to suffer heavy losses when emotion overpowered decisions. Embracing algorithmic methods revolutionized my approach: instead of reacting to breaking news, I learned to articulate precise hypotheses—such as “buy when the 20-day moving average crosses above the 50-day average”—and validate them through rigorous backtesting. Leveraging broker APIs and cloud infrastructure, algorithms execute trades around the clock with consistent precision. In this guide, I explain how to source and cleanse high-quality datasets, design backtests that incorporate realistic costs, implement dynamic risk controls, and monitor performance in real time. By adopting these techniques, you will build a resilient investment engine that adapts to changing market conditions and generate consistent sustainable returns.
2. Understanding Quantitative Trading
2.1 Definition and Principles
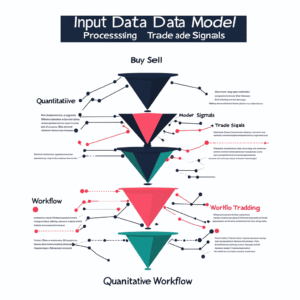
Quantitative trading applies mathematical models and statistical analysis to generate buy and sell signals. Rather than relying on gut instinct or breaking headlines, you express your market insights as algorithms that process price, volume, and alternative datasets—such as sentiment feeds or macroeconomic indicators—and make decisions automatically. This removes emotion, ensures consistency, and allows you to execute strategies at scales and speeds impossible to achieve manually. At its core, Quantitative Trading Basics: Automate straight-forwardly embodies these principles by turning hypotheses into reproducible code.
2.2 Historical Evolution and Accessibility
Algorithmic approaches date back to the 1970s when academics studied moving-average crossovers on paper. In the 1980s, improved computing power let institutions implement simple models. The 2000s saw high-frequency firms co-locate servers near exchange matching engines to shave microseconds off execution times. Today, retail traders access the same core tools—open-source Python libraries, cloud servers, broker APIs—at a fraction of the cost. This democratization means nearly anyone with curiosity and discipline can run sophisticated strategies from a laptop or low-cost virtual machine.
3. Core Components of a Quantitative Strategy
3.1 Hypothesis Formulation
Every robust system starts with a concise hypothesis: a repeatable market inefficiency. Examples include mean reversion—buying when a currency pair deviates far from its average—or momentum—buying stocks that have outperformed peers. Write your hypothesis in one sentence, such as “Buy when the 20-day RSI falls below 30 and exit when it surpasses 70 on liquid U.S. equities.” This clarity focuses your coding, testing, and optimization efforts.
3.2 Signal Generation
Signal generation converts cleaned data into actionable triggers. Techniques range from simple threshold-based rules to advanced machine-learning classifiers. You might calculate moving-average crossovers, regression slopes, or classification probabilities. When you apply Quantitative Trading Basics: Automate within your signal functions, every decision becomes deterministic: given the same inputs, your algorithm always outputs the same buy, sell, or hold recommendation.
3.3 Execution Logic
Execution logic defines how orders reach the market: market orders for immediacy, limit orders for price control, or more complex iceberg orders that hide large block sizes. Good execution systems handle partial fills, retries, and realistic slippage. Aligning live execution behavior with backtest assumptions is vital—without it, simulated performance can vastly overstate real-world results.
4. Data Acquisition and Preparation
4.1 Sources and Quality
Data quality underpins every strategy. Free sources—Yahoo Finance and Alpha Vantage—offer OHLCV (open, high, low, close, volume) for equities and ETFs. For deeper data—tick-level order-book snapshots, macroeconomic releases, or social-sentiment feeds—paid vendors like Bloomberg, Refinitiv, or specialized crypto APIs are necessary. Always verify data integrity: check for missing timestamps, duplicate entries, and correct corporate-action adjustments.
4.2 Cleaning and Normalization
Raw datasets often feature gaps, outliers, and misaligned timestamps. Clean data by forward- or backward-filling missing entries, trimming statistical outliers, and adjusting for splits and dividends. Normalize timezones across sources and ensure uniform sampling intervals. Proper hygiene prevents your algorithm from “learning” artifacts rather than genuine market patterns. For strategies that trade frequently, also consider cleaning for anomalies like flash crashes or exchange halts.
5. Backtesting and Validation
5.1 Framework and Design
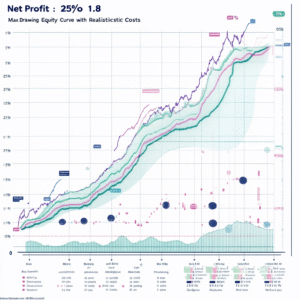
A modular backtesting framework separates data ingestion, signal generation, order simulation, and reporting. Tools like Backtrader, Zipline, or custom engines help enforce this structure. Design your framework so you can plug in new models without rewriting core logic. Report key metrics: net profit, Sharpe ratio, max drawdown, win rate, and trade distribution across time.
5.2 Walk-Forward Testing
Walk-forward testing guards against overfitting by simulating how your model would adapt to new data. Split historical data into sequential windows—optimize parameters on the first window, then test on the next unseen segment. Roll this process forward, aggregating results to assess stability across market regimes. Walk-forward analysis reveals whether your strategy can survive shifting conditions.
5.3 Realistic Cost Modeling
Subtract real transaction costs—commissions, slippage, financing fees—from backtest returns. For U.S. equities, assume slippage of $0.005–$0.01 per share; for futures, include exchange fees; for crypto, factor in network and miner fees. Honest cost modeling builds confidence that simulated gains will translate into net profits once live.
6. Automating Your Systems
6.1 Broker Integration
Automation begins by linking your code to a broker API—Interactive Brokers and Alpaca are popular for equities, Binance and Coinbase Pro for crypto. Securely store credentials using environment variables or secret management services. Build wrappers around API calls to handle rate limits, errors, and automatic reconnection.
6.2 Deployment and Scheduling
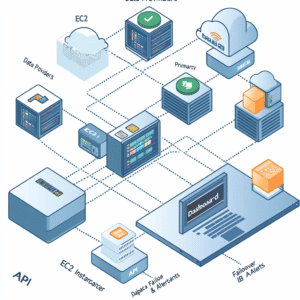
Deploy your strategy on reliable infrastructure: AWS EC2, Google Cloud Compute, or a reputable VPS provider. Containerize your application with Docker for consistent environments and orchestrate with cron or a more advanced scheduler like Apache Airflow. In my early days, I celebrated waking up to orders executed overnight without manual intervention—a clear sign the system was functioning.
6.3 Monitoring and Alerts
Hands-off trading still requires oversight. Log every trade, P&L update, and system error. Configure alerts—via email, Slack, or SMS—for critical events such as connection loss, order rejections, or drawdown breaches. A robust monitoring dashboard lets you spot anomalies and intervene before small issues become costly disasters.
7. Risk Management Techniques
7.1 Position Sizing
Effective risk control starts with conservative position sizing. Many quant traders risk 1–2% of account equity per trade, adjusting dynamically as the portfolio’s value changes. This approach prevents single losing trades from wiping out large swathes of capital.
7.2 Drawdown Controls
Beyond individual trades, implement portfolio-level drawdown limits—halt all trading if equity falls more than 5% in a day or 10% in a week. These rules preserve capital and reinforce discipline.
I’ve recently been diving into a resource called Institutional Trading Concept—a 190-page guide crafted by professional traders that breaks down the exact strategies banks and large funds use in the markets. It’s given me a fresh perspective on trade setups and risk management, so I thought you might find it useful too.
8. Infrastructure and Technology Considerations
8.1 Cloud vs. Co-Location
Cloud servers offer flexibility and global reach, but latency can fluctuate. Co-location—housing servers next to exchange data centers—reduces latency to microseconds at a higher cost. High-frequency strategies almost always require co-location; swing or daily algorithms often perform well na nuvem.
8.2 Latency and Redundancy
Design for network redundancy: multiple ISPs or VPN tunnels guard against outages. Monitor round-trip times and packet loss continuously. Low, consistent latency ensures timely order execution, making the difference between capturing a favorable price and missing the move.
9. Scaling and Maintenance
9.1 Version Control and CI/CD
Store all code in Git repositories with clear branch policies. Implement CI/CD pipelines that automatically run unit and integration tests on every pull request. Automated testing catches errors early and maintains system integrity as complexity grows.
9.2 Performance Tracking
Maintain dashboards comparing live performance to backtests—track metrics like slippage, fill rates, and latency histograms. Regularly review these reports to detect drift, recalibrate models only when statistically justified, and avoid “curve-fitting” adjustments after minor drawdowns.
10. Common Pitfalls and Best Practices
Even the best strategies can stumble if critical risks are ignored. Overfitting is a perennial threat: tweaking parameters to match every quirk of historical data often yields brittle models that fail in live markets. Use walk-forward analysis, limit free parameters, and reserve an out-of-sample period for ultimate validation.
Data integrity issues—missing bars, misaligned timestamps, or splits/dividends not adjusted—can teach your algorithm spurious signals. Implement rigorous cleaning pipelines, validate each new data feed, and monitor for anomalies continuously.
Infrastructure hiccups and latency spikes can turn a profitable edge into a costly loss. Establish redundancy with multiple servers and network routes, and set up automated alerts for connection failures or order delays.
Finally, never overlook compliance. Regularly review SEC guidance on algorithmic trading to avoid manipulative practices, ensure full transparency in order flows, and stay aligned with evolving regulations. Comprehensive documentation, peer code reviews, and extreme-scenario stress tests will transform these common pitfalls into opportunities for ongoing improvement.
11. Conclusion
Quantitative Trading Basics: Automate isn’t a one-off project; it’s the start of an ongoing journey that blends technical rigor with human insight. You’ve learned to crystallize a clear hypothesis, harness clean and reliable data, and build backtests that honestly account for real-world frictions. You’ve seen how thoughtful automation—linking code to broker APIs, deploying on resilient infrastructure, and setting up real-time monitoring—frees you from the emotional roller coaster of manual trading. Equally important, you’ve embraced risk management practices—from conservative position sizing to portfolio-level drawdown limits—that act as safety nets when markets surprise you.
Along the way, you’ll face setbacks: a promising model that falters in live trading, unexpected latency spikes, or parameter drift that erodes performance. Those moments are not failures but invitations to pause, investigate, and iterate. Celebrate every small victory—the first profitable live trade, a backtest that finally holds up under stress, or an alert that saved you from an unexpected market move. Each insight deepens your understanding of both markets and your own decision-making patterns.
Keep refining your approach: experiment with new data sources, explore alternative algorithms, and expand into different asset classes. Lean into community forums, share your findings, and learn from others’ experiences. Over time, your automated strategies will evolve from simple experiments into robust engines that adapt alongside shifting market regimes. In merging data-driven precision with disciplined reflection, you transform quantitative trading from a technical endeavor into a craft—one where curiosity, patience, and perseverance deliver the greatest returns.
12. FAQ
Q1: What programming skills are required to build and maintain quantitative trading strategies?
A1: You need at least basic proficiency in Python, including libraries like Pandas and NumPy for data manipulation, and an understanding of object-oriented design to organize your code. Learning a backtesting framework (Backtrader or Zipline) is essential, and familiarity with version control (Git) ensures reproducible development. Advanced traders may explore C++ or Java for low-latency systems, but Python suffices for most retail strategies.
Q2: How much capital do I need to get started with a quant strategy?
A2: You can begin with as little as $1 000 at a low-cost broker, which allows you to test basic models and cover transaction fees. As your strategies prove robust, scaling to $10 000–$50 000 improves statistical reliability and reduces the percentage impact of fixed costs. Always adjust position sizing so that you risk no more than 1–2 % of your equity per trade.
Q3: How can I prevent overfitting and ensure my backtests generalize to live markets?
A3: Use walk-forward analysis—optimize parameters on one time window, then test on the next unseen segment—across multiple market regimes. Limit parameter counts relative to data length, and include realistic costs (commissions, slippage) in every backtest. Reserve a final out-of-sample dataset for true performance validation before going live.
Q4: Which data providers offer reliable feeds for quantitative research and live trading?
A4: Free sources like Yahoo Finance or Alpha Vantage cover end-of-day OHLCV data well. For intraday or tick-level data, consider paid vendors—Bloomberg and Refinitiv for equities, and CryptoCompare or Kaiko for digital assets. Always verify timestamps, corporate-action adjustments, and missing records before trusting a feed.
Q5: How often should I review and update my models once they are live?
A5: Perform a structured review at least monthly, comparing live performance against backtests. Recalibrate parameters only when performance degradation exceeds a predefined threshold—avoiding knee-jerk changes after minor drawdowns. Quarterly or semiannual overhauls may include incorporating new features or removing underperforming signals.
Q6: What are the key risk-management controls every quant system must include?
A6: Implement position-sizing rules to cap risk per trade, hard stop-losses for individual positions, and portfolio-level drawdown limits (e.g., pause trading if equity drops 5 % in a day). Diversify across uncorrelated strategies and asset classes, and monitor real-time metrics—latency, fill rate, and equity curves—to detect anomalies before they escalate.